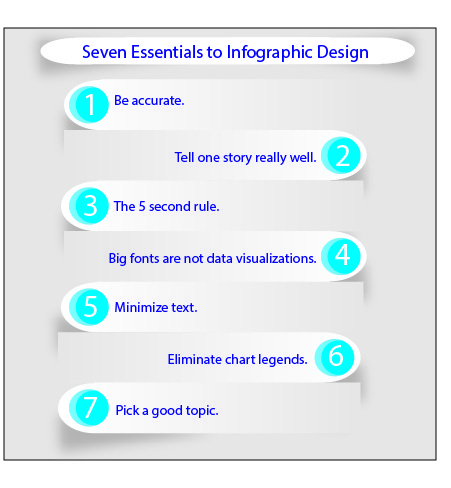
1. Be accurate. It seems obvious, but you will find infographics are not accurate. For example, make sure your pie charts add up to 100%.
2. Tell one story really well. An infographic that tries to do too much ends up not telling a story at all.
3. The 5 second rule. Most of the page view duration times are 5-10 seconds for infographics. Create infographics that tell a story quickly.
4. Big fonts are not data visualizations. Displaying the number in a large font doesn't make it any easier for the audience to understand.
5. Minimize text. Along the lines of #4 above. This is another tip that seems obvious, yet we see text-heavy infographics all over the web.
6. Eliminate chart legends. If the viewer needs a legend, your infographic's story might not be as clear as it should be.
7. Pick a good topic. Some topics are not as suitable for infographic display as others.